Wednesday 21 July 2021

Are we refreshed yet?

It’s often faster (especially when working remotely) to refresh a data extract on the server rather than using your desktop client.

An annoying part of this, though, is the constant refreshing waiting for the timestamp to change so you know that the refresh has finished.

Wait no more! Since Tableau 2020.3 was released you can set up a refresh alert using subscriptions which will allow you to go and do something else until that email arrives and then you can return to what you were doing. You should probably delete the subscription after this or it might get annoying.

Monday 20 January 2020

Reclaim Your Space

Although hard disks are cheaper per gigabyte than they’ve ever been, many business machines come out with surprisingly low capacity disk drives.

However, when I received the dreaded “Low space on drive C” message after operating a new computer for just a couple of hours, I thought this needed further investigation.

I ran a scan over the files and directories in my local disk and found that the Logs directory in Documents/My Tableau Repository was taking up 55 gigabytes!

I deleted this without hesitation.  Team-mates have reported 35 gigabytes and 44 gigabytes.  Realistically you only ever need the last few days’ worth of logs.

Keep this in mind as a location to target whenever you think your local disk is getting a bit too full

Wednesday 24 February 2016

WTPDF!?

Tableau has been designed for, and is best at, creating data visualisations and interactive dashboards; however, sometimes as Tableau developers we must swallow our pride because of client request, acquiesce, and put together workbooks which aren't necessarily so visual or interactive and feature some of the 'no-no's of Tableau development, like:
  • Printing
  • Report bursting
  • Data export (as a primary function)
  • Complex cross-tab filled financial reports
Alan Eldrige described these activities extremely well in his whitepaper 'Designing Efficient Workbooks' and in particular - why you should avoid them; so I won't get into that detail now.  I will however explore one of these activities: printing, and specifically one aspect of printing-related activities - PDF generation.

During a project I've been working on for the last couple of months, I have been asked to create a workbook which can easily be converted to a PDF for distribution and archive.  Of course I explained my hesitation but proceeded to put together a design that would be just as clean and clear, evenly laid-out and generally well-presented on screen in Tableau Server as it is as a PDF document and therefore also, when printed.

I stumbled across a few issues during this process but thankfully found fixes, or at least - workarounds, for each.

War on Error


Firstly, it just didn't work.


I could neither find any posts on the Tableau Support Community nor could I find any other references to this error, let alone fixes, anywhere else on the Web.  I wasn't particularly surprised, though, since I have been aware for some time that this is not a core function for Tableau, it is not something that is discussed very often on the forums or blogs, and it's a feature that receives little development priority.

I figured that the resources required to render the PDF pages exceeded the allowance provided by Tableau Server so I tried generating one using a workbook with some of the views deleted and indeed, it worked.  This wasn't quite acceptable, though, so rather than exporting to PDF from the workbook hosted on our Tableau Server, I tried Print to PDF from the File menu within Tableau Desktop to create a PDF of the whole workbook and - voilĂ  - it worked!

So for this issue, the takeaway is that Tableau Desktop is more capable than Tableau Server to render PDFs - especially if your workbook is large and/or complex.
Update - 29 February 2016
I just stumbled across this interesting note as I was browsing through recent Tableau release update details.

The version of Tableau Server in operation at my workplace is 9.0.4.

The release notes for 9.0.8 include the following:

In Tableau Server, attempting to export a workbook that contained story points to PDF sometimes failed to produce a PDF.

This suggests that there was a known problem in versions prior to 9.0.8 that has since been resolved; therefore, when we next upgrade our installation of Tableau Server, the “Error Producing PDF” message will no longer be seen!


Lost in Space


Next, I opened up this PDF... and saw this:


The problem here is not the blurriness - I did that intentionally for the blog post.  The problem is the layers of text that have been stacked on top of each other on the top left below the story point navigation and the vast expanse of white space on the page.  That was not supposed to be there.  There was a whole lot of stuff that was supposed to be there.

So this was quite disheartening.  I was stuck. Much of my workbook had DISAPPEARED!  Well, not really.  The PDF pages had not rendered correctly - and when I said this to myself a few times, I started on a line of thinking that brought me towards a successful outcome.

The PDF pages had not rendered correctly

pages had not rendered correctly

not rendered correctly

*rendered*

Okay, so I figured that there was an issue with the rendering!  Of course, I'm well aware that many of the error messages that we see when we're waiting for our views whether in Desktop or Server are somewhat rendering-related. I don't know the mechanics but I guess that the PDF-generation engine struggled to take the design from Tableau Desktop and then render it into a PDF.

From here I thought that maybe there should be one step taken out of the process .. so I tried to reduce the load on the PDF generation engine and ensure that the bulk of the rendering was taking place in Tableau Desktop.  To do this, the only path I could think of was to click through every view, from the first to the second to the third to the 28th in this case, and then once Tableau Desktop had cached the views, then try the the PDF-generation process again.... and you betcha - success!

I Just Want To Fit In


Lastly, once I managed to see all the content rendered on every page of the PDF, I was disappointed to see that the content did not fit the page.


It seemed as though I had chosen unsuitable dimensions for my layout so I built a dashboard that was much wider and much taller with varying sized layout containers inside.  I figured that I would be able to identify where the PDF cut off the right side and the bottom of my dashboard and that I could determine exactly what the ideal dimensions were.


So that didn't quite go to plan - it rendered the whole thing rather than cutting off the edges.  This suggests to me that there is no ideal height and width.  Your entire view will always be rendered when you generate a PDF.  The trick is to get the same aspect ratio as an your page.  In my case, I was using A4 which is 210mm x 297mm which approximately equals a height/length ratio 1:1.41.

I adjusted my view accordingly but found that this still left a wider right margin than the left margin.  After a bit more investigation, I came across the ideal ratio which allowed for the 11mm margins that the PDF generation process applies which was 1:1.47 being a width of 1365 and a height of 927.

If you wish to produce a PDF for a different page size, eg letter, you will need to adjust the ratio accordingly which may involve a little trial and error but essentially all you need to keep in mind is that there will be a fixed margin size and within that boundary your Tableau view needs to match the aspect ratio that remains.

As always, if you have any questions or any thoughts on how to better solve these problems, please feel free to add a comment below.

TFB

Wednesday 13 January 2016

How to Clean Your Filter


For my first post of actual content, I thought I'd start off with something that is quite simple but also is an extremely effective way to solve a problem that many Tableau developers face very regularly; that problem being the issue of restricting entries that appear in a Quick Filter list.

Essentially what this tip addresses is the need to allow the your users to make a selection from a list of filter values but also for you as the author to be able exclude certain records from that filter list. You may wish to do this because selecting (or even viewing) one of the extra values...
  1. may look untidy,
  2. may cause confusion,
  3. may result in an empty worksheet, or even
  4. cause a security issue.
So, after we've created our basic filter, what options do we have to be able to solve this problem?

Go to the Source!

This filter needs cleaning!
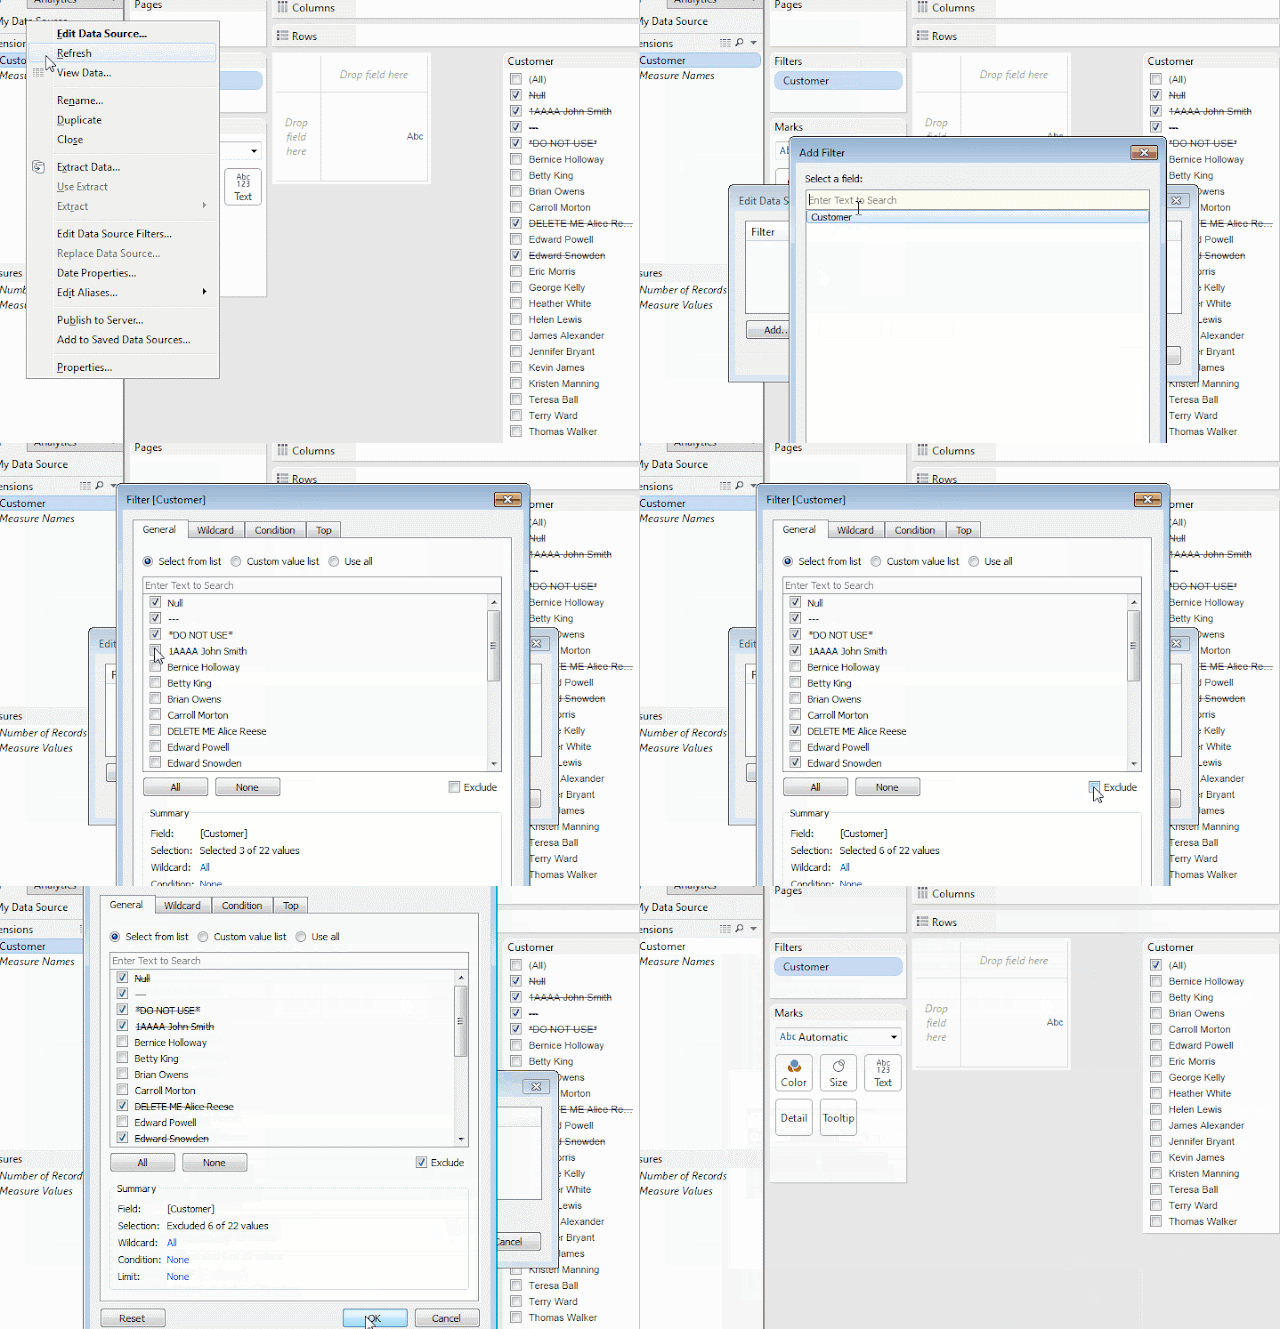
One method is to set a Data Source Filter which you can do so in six simple steps:
  1. right-click the name of the data source
  2. click Edit Data Source Filters
  3. choose the field on which you will base your filters
  4. select the values you wish to exclude
  5. click the Exclude checkbox
  6. click OK twice

How to create a Data Source Filter that excludes values from a dimension


Any Quick Filter you have based on the field at step 3 will then refresh to no longer show the excluded values.

In this particular example, a couple more clicks are required to prepare the Quick Filter:
  1. open the context menu for the Quick Filter by clicking the down arrow in the top-right of the Quick Filter panel
  2. click Include Values
Now your users will be able to choose which values they wish to keep rather than choosing values to exclude from the view. 

Switch your Quick Filter from Exclude to Include

Using a Data Source Filter to restrict Quick Filter entries is very simple to do but is quite brutal because excluding values at this level means that none of the rows that contain these values will be available to any worksheet that connects to your data source.


For example, let’s say there was a separate view in my workbook that showed inventory levels for different products in my retail store.  Since we excluded the NULL Customer Name in the data source filter, we would not be able to see any new product lines.  This is because no customers have bought them yet therefore would have NULL in the Customer Name field after joins.

Copy That, Good Buddy


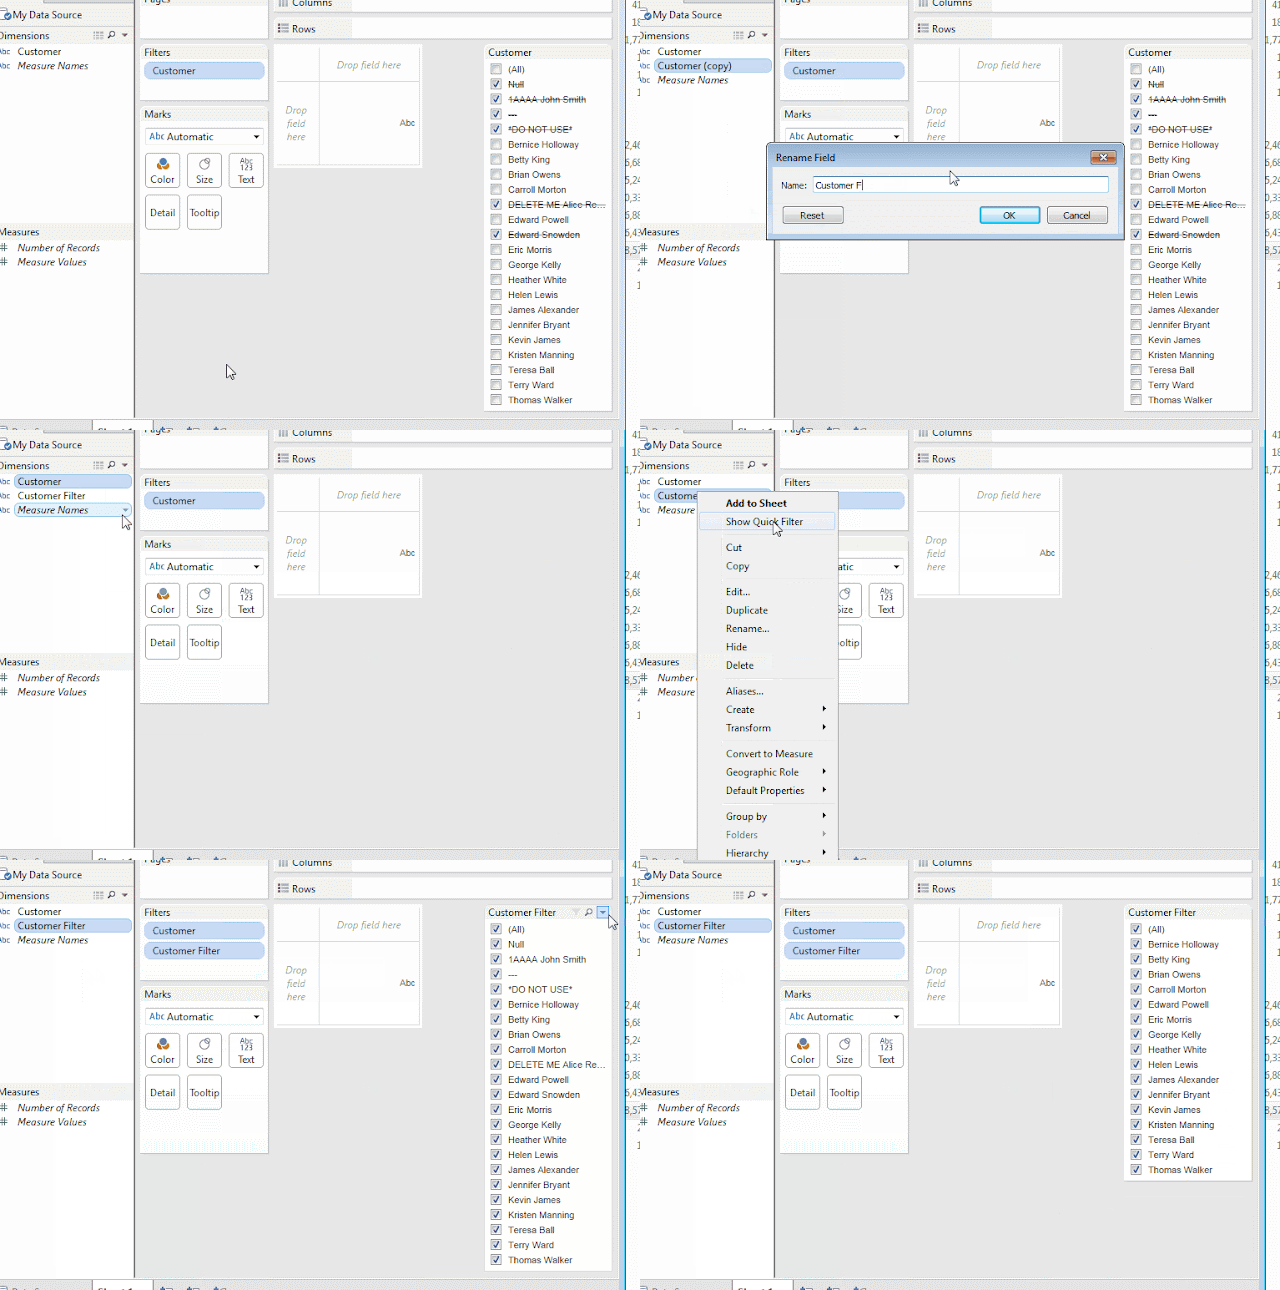
The following is the most commonly described solution you’ll find around the Web and for good reason – it works!  Although, it requires the source field be duplicated and there are a few more steps involved:
  1. duplicate your dimension
  2. rename the new dimension
  3. right-click your original dimension pill
  4. uncheck Show Quick Filter
  5. right-click your new dimension pill
  6. click Show Quick Filter
  7. bring up the context menu for the Quick Filter
  8. click Only relevant values
After choosing the ‘Only relevant values’ option those values previously excluded in your original dimension filter will disappear.
How to restrict your Quick Filter entries with a cascading filter

Sets Appeal


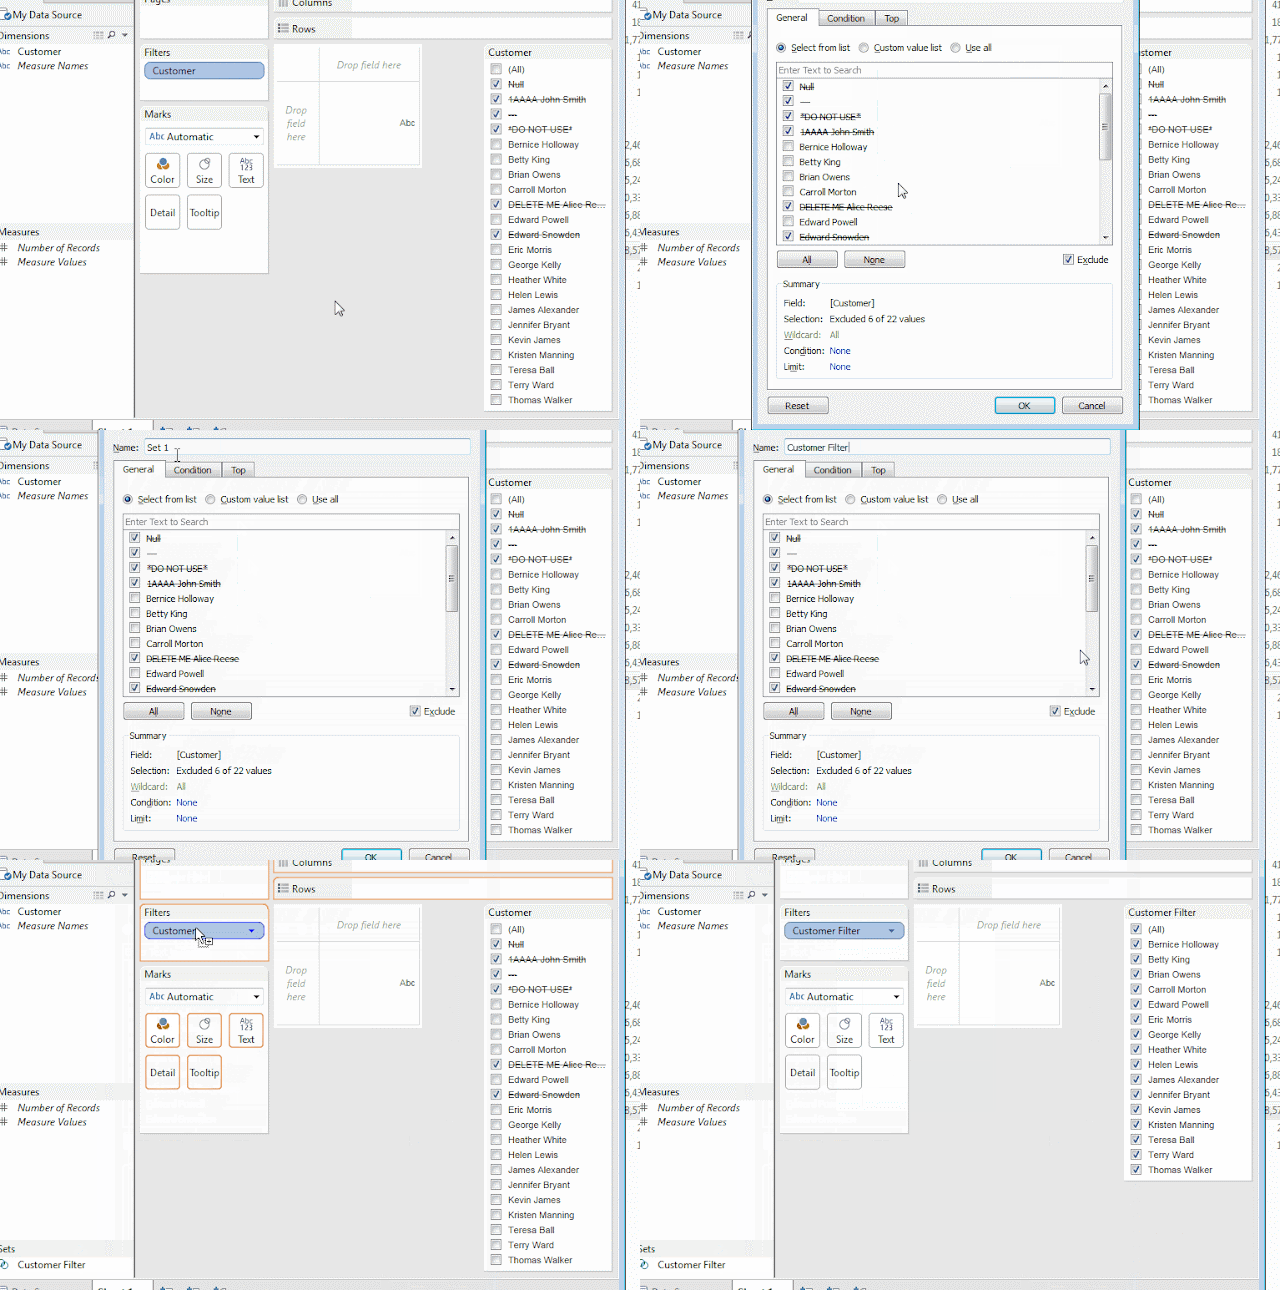
I find this option to be a little more elegant, simpler and fit for purpose.  Sets already have a close relationship with filters and this requires no duplication of fields.

  1. right-click your dimension pill on the filters shelf
  2. click Create Set
  3. give your set a name
  4. click OK
  5. drag the newly created set and drop it directly on top of the dimension pill on the filters shelf
  6. right-click the set pill
  7. click Show Quick Filter
How to use Tableau sets to restrict your Quick Filter entries
There you have it.  The extraneous values have gone and your Quick Filter is now a neat and clean list.

One drawback of these methods is that you can't apply the same techniques to a filter that is based on Tableau's generated fields such as Longitude, Latitude or Measure Names.  Measure Values can't be used either, but if you tried to create a dimension filter using Measure Values, Tableau will in stead create one using Measure Names.

If you have any questions or any thoughts on how to better solve this problem, please feel free to add a comment below.

TFB

Friday 1 January 2016

So .. hi


So I've decided to start a blog.

I've been using Tableau for a little over four years and I feel like there are quite a few bits and pieces that I've discovered over the distance that would help beginners and enthusiasts alike... and I would be quite happy to hear from others who may know different and/or better ways to achieve the same outcomes for ideas that I have.


I currently work for the National Broadband Network in Australia where I provide support to our end-user Tableau developer community, consult on dedicated project work and conduct in-person and online presentations.


Using Tableau offers me a perfectly-suited opportunity to capitalise on the range of skills I have attained over my two decades in various IT-based roles and in educational pursuits. In particular, it allows me to take on visual design tasks, process and manipulate data, do a bit of programming and explore Web design and development activities.  


I hope the techniques, ideas and commentary I'll present will help someone to get their work done faster or reveal something new to someone out there.


TFB